Solar I-V and P-V Curves
Introduction
Solar panels convert light energy to electrical energy, and their performance depends on strength of sunlight, orientation, and resistance. The purpose of this lab was to understand how solar panels behave in various conditions. In this lab, we investigated the performance of a 10 W solar panel under varying load conditions using a resistor decade box. We measured current and voltage under varying resistances and panel orientation.
Methods and Measurements
We used a 10 W rated solar PV panel, resistor decade box, and two multimeters to measure voltage and current. We configured the decade box for twelve values from 1 to 100 ohms and recorded the voltage and current (table 1). We also measured voltage and current for partial shading (table 2) and angle/direction (table 3).
| Resistance (ohm) | Actual Resistance (ohm) | error % | Voltage V | Current A | Power P |
|---|---|---|---|---|---|
| 0 | 0 | 0 | |||
| 1 | 1.3 | 30% | 2.83E-01 | 0.217 | 0.0614327 |
| 5 | 5.3 | 6% | 1.14 | 0.215 | 0.2451 |
| 10 | 10.3 | 3% | 2.234 | 0.219 | 0.489246 |
| 20 | 20.7 | 4% | 4.58 | 0.22 | 1.0076 |
| 30 | 29.4 | -2% | 6.49 | 0.22 | 1.4278 |
| 40 | 40.3 | 1% | 9.09 | 0.227 | 2.06343 |
| 50 | 50.5 | 1% | 9.67 | 0.239 | 2.31113 |
| 60 | 60.8 | 1% | 14.9 | 0.245 | 3.6505 |
| 70 | 70.5 | 1% | 16.88 | 0.238 | 4.01744 |
| 80 | 83 | 4% | 18.24 | 0.219 | 3.99456 |
| 90 | 89.9 | 0% | 18.81 | 0.206 | 3.87486 |
| 100 | 100.2 | 0% | 19.1 | 0.191 | 3.6481 |
Table 1: experimental voltage, current, and power data based on resistor box. The first column, Resistance, is the target resistance configured on the decade box, and the second column, Actual Resistance, is the resistance measured by the multimeter.
| shading | Voltage V | Current A | Power W |
|---|---|---|---|
| none | 12.21 | 0.174 | 2.12454 |
| 1 cell | 6.4 | 0.092 | 0.5888 |
| 4 cells | 2.909 | 0.041 | 0.119269 |
| 1 full column | 1.129 | 0.014 | 0.015806 |
| full panel face down | 1.05E-01 | 0.001 | 0.000105 |
Table 2: experimental voltage, current, and power due to shading.
| Angle/Direction | Voltage V | current A | power W |
|---|---|---|---|
| nominal | 17.09 | 0.237 | 4.05033 |
| 90CCW | 14.1 | 0.193 | 2.7213 |
| 180CCW facing away from sun | 5.3 | 0.075 | 0.3975 |
| horizontal | 11.3 | 0.165 | 1.8645 |
Table 3: experimental voltage, current, and power data based on angle/direction of panel.
Calculations and Results
The shape of our I-V curve (figure 1) generally follows the trend of the standard curve. In our I-V curve, the current seems to increase slightly as voltage increases, and we believe that is caused by changes in cloud cover during data collection. As clouds moved, more direct sunlight reached the panel.
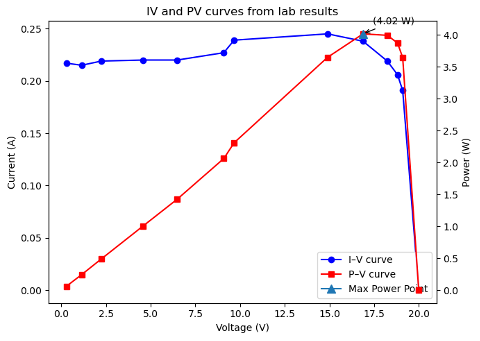
Figure 1: IV and PV curves from table 1 measured voltage and current. Maximum power point is plotted on the PV curve at P = 4.02 W.
Our experimental values for Pmax, Isc, and Voc were 4.02 W, .18 A, and 20.3 V respectively. The specifications of the 10W-rated panel for Pmax, Isc, and Voc are 10 W, .64 A, ~21.7 V. The measured Isc (and consequently Pmax) was much lower than expected because it was overcast while we were gathering data. The measured Voc was close to the manufacturer’s specification.
Our relative resistance value errors (figure 2) were fairly low. We configured the switches on the resistance box such that the measured resistance was as close as possible to the target resistance. The errors did not appear to have a noticeable effect on the experimental data.
Figure 2: percent error versus measured resistance graph shows low error rates. The high error rate for x = 1 ohm (measured 1.3 ohm) is because small values exaggerate the actual error.
If the 10 W-rated panels are 15 years old and the panel rating is expected to degrade .5% per year, the panels should be producing at a 7.5% loss, equivalent to 9.25 W. Our measured power output was 4.02 W which is far below that. However, we are unable to make conclusions about panel aging because we believe that overcast meteorological conditions were the primary contributor to the panel inefficiency.
Conclusion
We can conclude that environmental factors including irradiance, shading, and orientation can affect power output of the panel. Greater shading reduces efficiency. The resistance at the maximum power point was approximately 70 ohms. As the panel’s angle away from the sun increases, the output decreases.