Jet Propulsion Vehicle Design Report
Abstract
In this lab activity, we designed and optimized a vehicle capable of quickly traversing a 75-inch distance as well as effectively transporting a payload to a target. We iteratively developed the vehicle; notable features include the propulsion system using a converging nozzle design 3D-printed, the laser-cut wooden body of the vehicle running on stable plastic wheels, and its modularity allowing for swapping of parts without rebuildling the entire vehicle. Through testing and redesigns, we identified key factors influencing performance including nozzle diameter, balloon size, and construction materials (mass of vehicle). After several design iterations and analyzing the data collected from the competition, the nozzle with 10mm exit diameter on a vehicle with thick 6mm wheels proved to be optimal in terms of reliability. While this vehicle was neither the fastest nor the most capable of transporting weight, it did perform consistently during each competition trial.
Design Process
Wheels
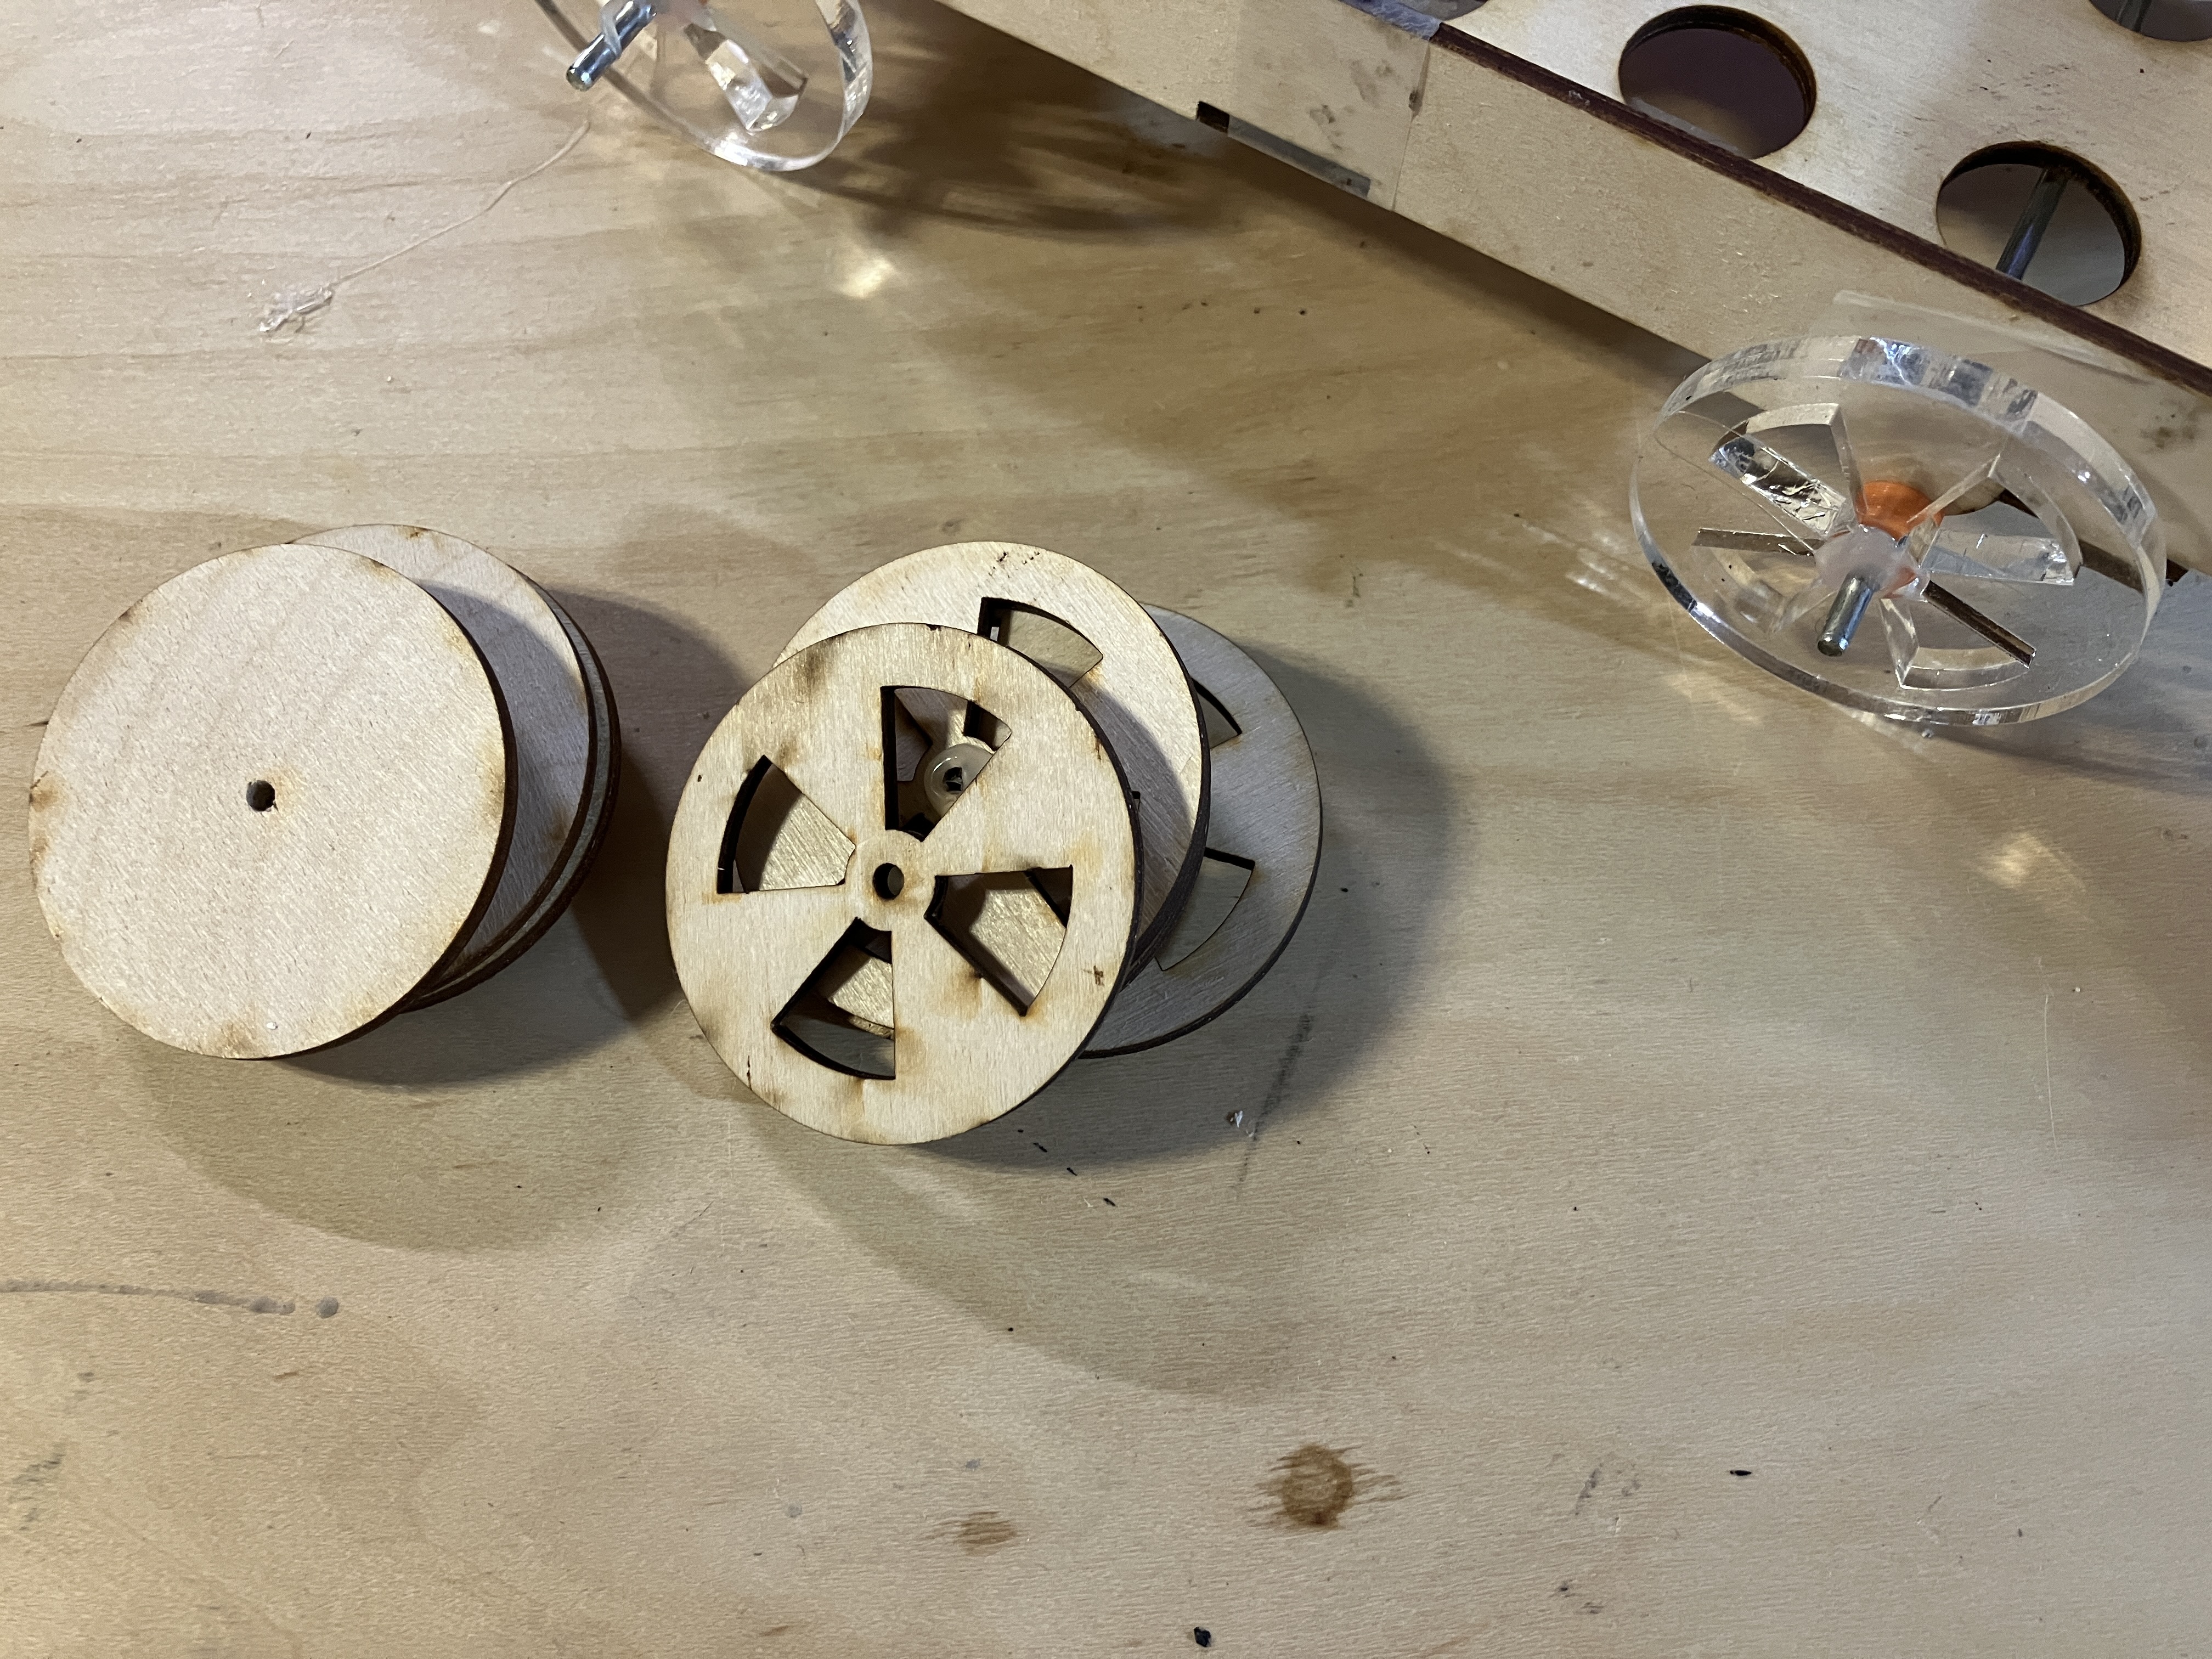
For our initial design we designed simple wheels consisting of 2 concentric circles cut out of 3mm plywood. After testing, we noticed the plywood wheels were often warped and wobbled on their axis due to the thinness of the material. We took this knowledge and fabricated another set of wheels using more rigid material, 6mm acrylic. To reduce the weight added by changing the material and thickness we added "spokes" that we had previously been wary of using on the weaker material of wood.
Fig 1. from left to right: concenctric circle design 3mm plywood, spoked design 3mm plywood, and spoked design 6mm acrylic
Body
We started with a basic rectangular geometry with base dimensions of 20cm by 10cm and height 2.5cm. To attach the axles, our initial solution was to attach 3d-printed, extruded semi-circles to the bottom of the vehicle (fig 2), but we quickly realized it would be difficult to print and awkward to attach. The long axle troughs would also increase friction due to more contact with axles.
Fig 2. initial design with long axle troughs
In our final design (fig 3), we placed tabs on side pieces to secure the axles, perforated the base to reduce weight, added a slot on the back wall piece to hold the nozzle, and modified the drawings to include finger joints for assembly.
Fig 3. drawing of final body design with nozzle holder, tabs for axles, and joinery
Fig 4. final vehicle, assembled
Nozzle design
We fabricated 4 nozzles of varying exit diameters—15mm, 12.5mm, 10mm, and for good measure, 5 mm. Using an early prototype, we ran trials to observe behaviors of each nozzle, specifically looking at the acceleration zone. We were able to rule out the smallest nozzle (5mm exit diameter) because it seemed to be incapable of reaching a reasonably high velocity and did not reach the second gate for the required distance of the speed trials. When testing the largest nozzle (15mm exit diameter), we noticed that inflating the balloon to greater volumes caused the vehicle to travel further and with more speed; however, the acceleration took longer and did not reach its maximum velocity until after it passed the second gate. With reasonable confidence, we ruled out our 5 mm and 15 mm nozzles. With our remaining two nozzles of 10mm diameter and 12.5mm diameter, we ran 5 trials per nozzle using a constant balloon size recording time to traverse a 75" distance. Our results favored our 10 mm nozzle producing an average velocity of 1.324 m/s as opposed to the average velocity of 1.083 m/s produced by the 12.5 mm diameter nozzle.
Additionally, we wanted to optimize our balloon size to make full use of the acceleration zone and ensure it reached its maximum velocity in the 75" zone. To do this we ran a series of tests with our 12.5mm nozzle and recorded the time to traverse gates vs balloon circumference. A balloon circumference of 29 inches proved produce highest velocities.
Experimental Data and Results
A sonar placed at the end of the track was used to collect position data over time. As such, in the raw data, the coordinates of position decrease as time increases because the vehicle gets closer to the sonar. There were a few sonar readings that indicated extraneous noise, potentially introduced by motion detected in the background of the vehicle. To mitigate this, we truncated those values and used linear interpolation to fill in the gaps, although this may have introduced some fluctuations. To better visualize the data, we remapped the position values such that x=0 corresponds to the first photogate. This means that the position values leading up to the first gate are negative and increase as the vehicle travels down the course.
During trials one and two, our vehicle veered too far to the side of the track, placing it out of the sonar’s range. As a result, the position data for the last .352 seconds of trial one and .214 seconds of trial two before reaching the second photogate are derived from linearly interpolated values. In the recorded data, multiple gate-state changes occur due to the laser briefly reconnecting with the photogate while the vehicle body traverses the laser, either underneath the body or through the wheel spokes. This fact was taken into consideration when calculating the total time to traverse each photogate, deltatpg.
The rest of the report is on this PDF because this site can't render nice equations, yet.